Heat Sensor App
Challenge
Managing and interpreting large volumes of sensor data can be complex, making it difficult for users to quickly identify patterns, anomalies, and performance issues. Traditional dashboards may lack intuitive visualization and centralized control.
Solution
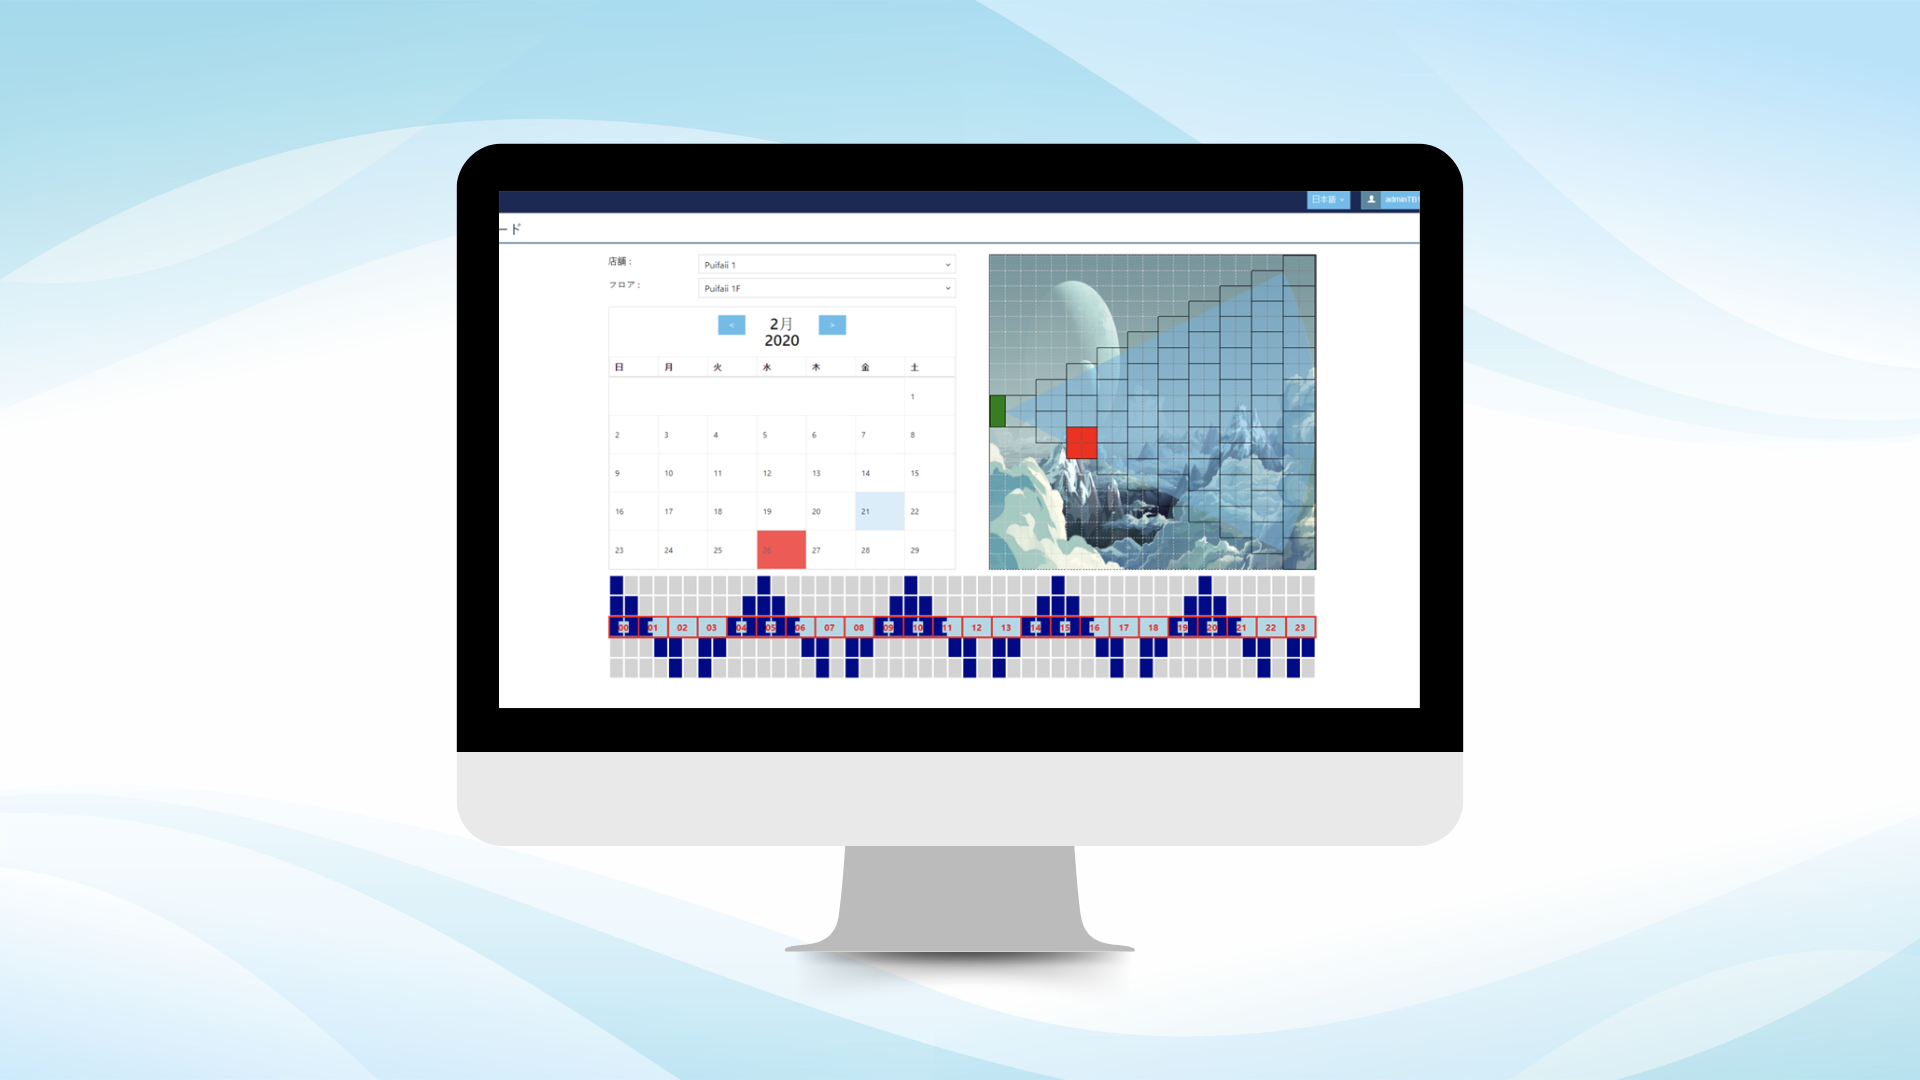
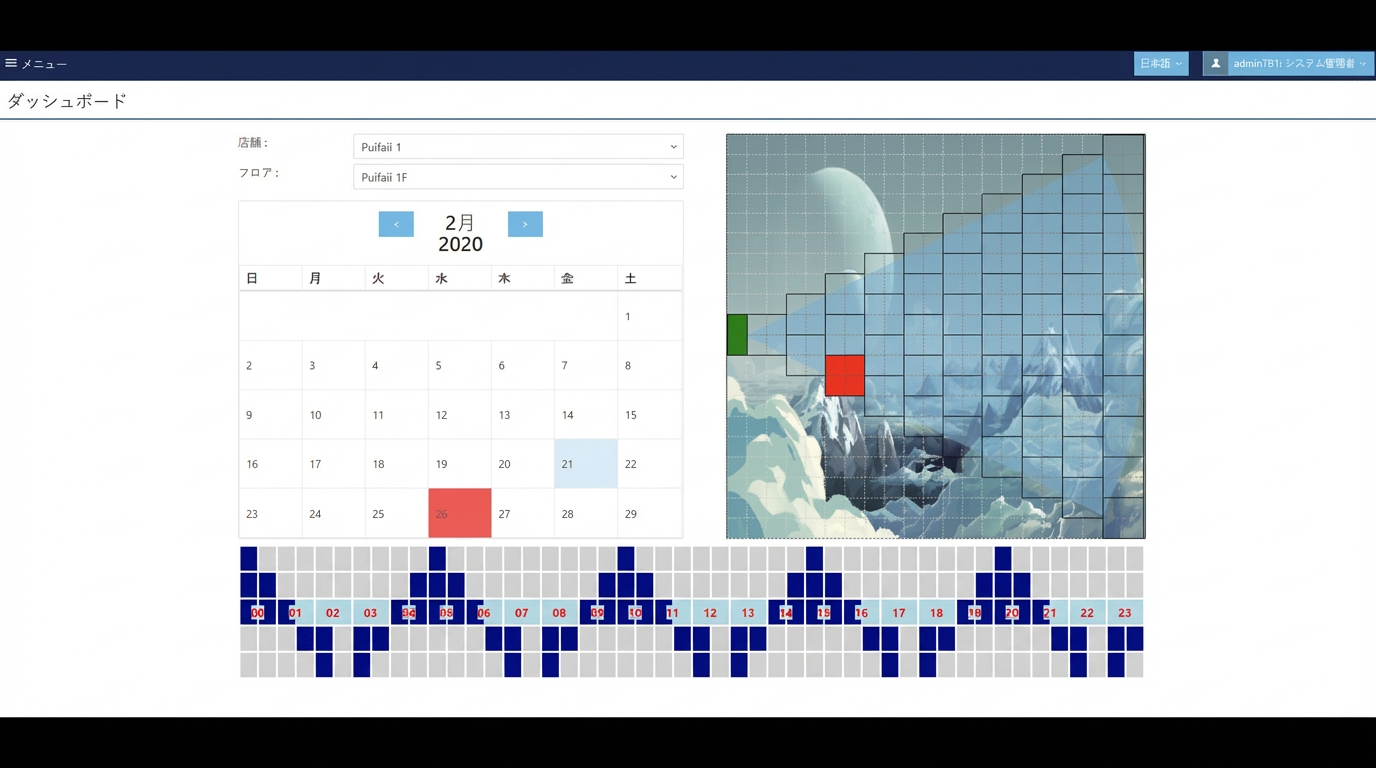
A backend CMS is developed as a sensor dashboard, providing centralized data management and advanced visualization features such as heat maps. Users can monitor sensor activity, analyze data trends, and manage configurations through an intuitive interface.
Outcome
- Enhances data visibility. - Improves decision-making. - Enables faster detection of issues. - Supports more efficient monitoring and optimization of sensor performance.
You might also like
Related Projects


Inspired by this project?
Let's talk about how we can build something great together.
Privacy Policy & Cookie Policy
This website uses cookies to improve your experience and analyze site usage. By continuing to browse this site you consent to the use of cookies. Please visit our Privacy Policy for further details.